Table of Contents
A cement mill separator determines which particles become finished product and which particles return for further grinding. Its performance has a direct effect on cement fineness, circulating load, mill power consumption, and production capacity. The Tromp curve is one of the most useful tools for evaluating separator performance. It shows how particles of different sizes are divided between the fine product and coarse reject streams. With a correctly prepared Tromp curve, plant teams can assess cut size, separation sharpness, bypass, and opportunities for cement mill optimisation.
What Is a Cement Mill Separator?
After material is ground in a ball mill, vertical roller mill, roller press circuit, or combined grinding system, the discharge contains a mixture of fine and coarse particles. The fine fraction is suitable for the finished cement product, while coarse material must be returned to the mill. A separator, also called a classifier, performs this sorting function:
- Fine product: Particles carried onward to collection equipment and ultimately to storage.
- Coarse reject: Oversized particles returned to the mill for additional grinding.
- Separator feed: The mixed stream entering the separator before classification.
Effective separation prevents already-fine material from being ground unnecessarily. This can increase mill throughput, reduce power consumed by the mill, and help maintain a higher proportion of active fine particles in cement.
Why Separator Efficiency Matters in Cement Grinding
Grinding and classification operate as one circuit. A mill can produce fine material, but the separator must recover that fine material efficiently while rejecting the correct coarse fraction. A poorly performing separator can create several operating problems:
- Fine particles return to the mill with reject material.
- Coarse particles report to the finished product.
- Circulating load increases unnecessarily.
- Mill power is spent regrinding particles that are already fine enough.
- Product fineness becomes harder to control.
- Production capacity may decline.
Separator evaluation is therefore not just a laboratory exercise. It is a practical way to identify classification losses and improve the overall grinding circuit.
Types of Separators Used in Cement Grinding
Cement grinding circuits commonly use static and dynamic separation equipment. The key difference is whether the separator uses a motor-driven rotating element.
Static separators
A static separator has no driven rotating cage. Separation is mainly produced through air flow, gravity, material impacts, and the physical path through internal components. Common static separation equipment includes the following.
Cyclones
A cyclone separates solids from air through the motion of the gas and the action of aerodynamic drag and gravity. Material enters with the air stream, while particles move toward collection under the cyclone’s flow pattern and settle downward. The cleaned air exits separately. Cyclones are commonly used downstream of separators to collect the fine product from the air stream.
Guide vane static separators
Static separators can contain adjustable guide vanes. Changing the vane angle changes the internal flow path and affects separation. Guide vane angles may be adjusted from 0 to 60 degrees depending on the separator design and operating target. Coarser particles tend to lose momentum, strike internal surfaces, and fall toward the reject stream. Finer particles are carried with air toward the product collection system.
V-separators
V-separators use baffle plates to create repeated impacts and aerodynamic separation. Material fed from above contacts the baffles. Coarse material falls downward, while fine material is carried away with air. They are commonly used in roller press grinding systems as part of the material classification circuit.
Dynamic separators
A dynamic separator uses a motor-driven rotating cage or rotor. Air is drawn through the separator by a fan, and particles are classified under the combined effects of air drag, centrifugal action, gravity, and collisions with separator components. Important forces acting on particles in a dynamic separator include:
- Air drag force: Carries finer particles with the air stream.
- Radial air drag force: Influences particle movement toward or away from the rotating zone.
- Centrifugal force: Tends to move larger or heavier particles outward.
- Gravitational force: Pulls particles downward toward the reject path.
For background on this force, see Britannica’s explanation of centrifugal force.
What Is a Tromp Curve?
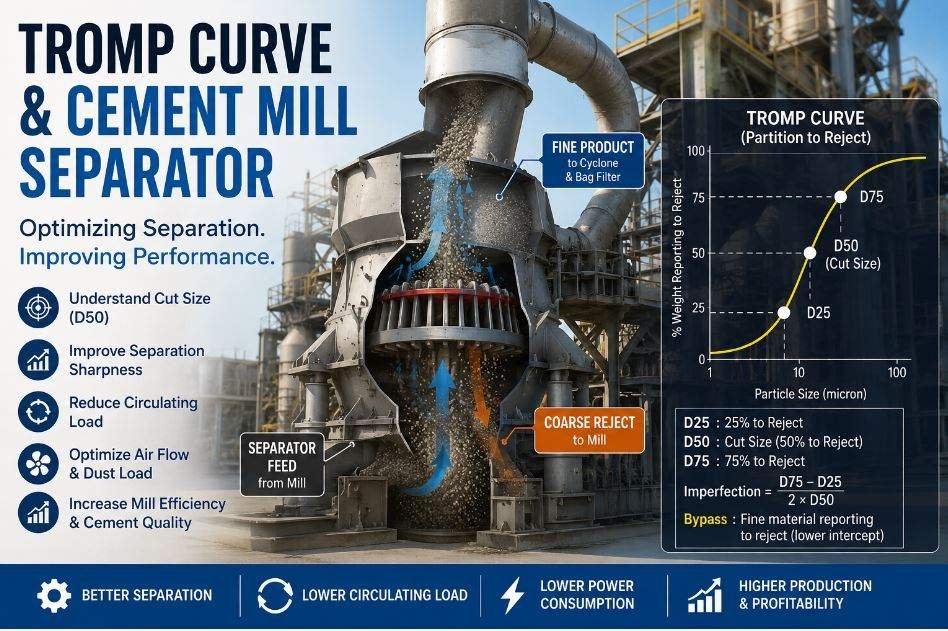
A Tromp curve, also known as a partition curve, is a graph that describes the probability of particles in each size class leaving a classifier through the reject stream. In cement applications, it is generally expressed as the percentage of particles in each size interval that reports to the separator reject. It can also be expressed in terms of the fine product, but reject probability is the conventional approach for cement separator studies. The curve is prepared using particle size distribution data from three streams:
- Separator feed
- Separator reject, or coarse stream
- Separator fine product
A mass balance is then performed for each particle-size fraction. For cement, the assessment commonly covers approximately 1 to 100 microns. For raw meal, the size range can extend to approximately 200 microns.
Important Note for VRM Applications
Tromp curve analysis in a Vertical Roller Mill (VRM) is more challenging than in a conventional ball-mill circuit.
In many VRMs, the separator feed is an internal air–material stream, making representative sampling difficult. Similarly, separator reject often returns directly to the grinding table and may contain a mixture of coarse circulating material and relatively large fresh-feed particles.
Therefore, fresh feed PSD should not automatically be considered the separator-feed PSD, and a sample taken from the grinding table should not automatically be treated as a true separator reject sample.
A reliable VRM Tromp curve may require dedicated sampling arrangements, representative gas–solid sampling, and a detailed circuit mass balance.
How to Prepare a Tromp Curve for a Cement Separator
A reliable Tromp curve depends on representative circuit sampling and correct particle-size analysis. The basic process is as follows.
1. Identify the three sampling locations
Collect samples from the three separator streams:
- Separator feed: Often taken from mill discharge, bucket elevator discharge, or the air slide carrying material to the separator.
- Separator reject: The coarse material returning from the separator to the mill.
- Separator product: The fine material collected through the cyclone system before it enters the cement silo.
Samples should represent stable operating conditions. A sample taken during abrupt feed, air flow, or separator-speed changes may not describe normal separator performance.
2. Measure particle size distribution
Analyse each sample for particle size distribution, or PSD. Depending on plant practice, this may include sieve residues at key sizes such as 212, 90, and 45 microns, as well as a more detailed size distribution. The 45-micron fraction is particularly important in many cement fineness evaluations. Blaine fineness may also be checked, but it does not replace a complete PSD when preparing a Tromp curve.

3. Perform the circuit mass balance
Use the PSD of the feed, fine product, and reject to calculate the split for every size fraction. The purpose is to determine what portion of each size class has entered the reject stream. This calculation produces the Tromp values that are plotted against particle size.
4. Plot particle size against reject probability
On a typical Tromp chart:
- The horizontal axis shows particle size in microns.
- The vertical axis shows the percentage of that size fraction reporting to reject.
The shape of the curve provides a visual measure of separator behaviour. A good separator produces a relatively steep transition between particles that mostly go to product and particles that mostly go to reject.

The Three Main Parameters of a Tromp Curve
A Tromp curve is most useful when interpreted through three main parameters: cut size, sharpness of separation, and bypass.
1. Cut size, D50
The D50 cut size is the particle size at which there is an equal probability of going to the fine and coarse streams. At D50:
- About 50% of particles of that size report to the reject stream.
- About 50% of particles of that size report to the fine product stream.
For example, if the D50 is 30 microns, particles near 30 microns are at the separator’s decision point. Smaller particles are more likely to go to product, while larger particles are more likely to return as reject.
A smaller cut size produces a finer final product. If a plant needs finer cement, the separator must generally operate at a lower cut size while maintaining acceptable sharpness and bypass. Cement separator cut sizes are often assessed in the approximate 25 to 50 micron range, depending on the required cement fineness and the operating objectives of the grinding circuit.
2. Sharpness of separation
Sharpness describes how clearly the separator divides fine and coarse particles around the cut size. A sharp curve rises quickly. A flatter curve indicates a less precise separation. When the curve is flat, excessive coarse particles can reach the fine product and excessive fine particles can return to the mill. Both outcomes reduce classification quality. Sharpness can be evaluated using a ratio based on D25 and D75 values. The closer this ratio is to 1, the sharper the separation. In practical operation, values above the ideal may occur because real separators do not produce a perfectly precise split.
3. Bypass
Bypass represents the portion of material that reaches an outlet stream without undergoing effective size classification. Its appearance on a Tromp curve depends on the partition convention used to construct the curve. When the curve is expressed as partition to reject, a non-zero fine-end intercept indicates the proportion of fine material reporting to the reject stream without effective classification or due to misplaced material. Therefore, the Tromp curve convention should always be clearly stated when interpreting bypass.

The Imperfection Factor
The imperfection factor provides an objective way to evaluate separator performance independent of absolute scale. It normalizes the sharpness of separation relative to the cut size using the following relationship:
A lower imperfection value indicates a more precise classification boundary. Industrial operations use the following general benchmarks to classify separator behavior:
- Under 0.2: Excellent separator performance with minimal misrouted particles.
- 0.2 to 0.3: Good, highly efficient industrial separation.
- 0.3 to 0.4: Normal performance for standard closed-circuit systems.
- Above 0.4: Poor classification efficiency, often pointing to internal blade wear, air leaks, or feed surging.
“Indicative values may vary depending on separator design, material characteristics, and operating conditions.”
Rotor Speed Dynamics in Daily CCR Operation
Adjusting the separator rotor speed (RPM) is the primary real-time control tool for Central Control Room (CCR) operators to manage cement fineness and product quality on the fly.
- Increasing Rotor Speed: A higher rotor speed increases centrifugal force, throwing borderline coarse particles outward into the reject stream. This lowers the D-50 cut size, concentrates finer particles in the product stream, and raises the final product’s Blaine value.
- Decreasing Rotor Speed: A lower rotor speed reduces centrifugal force acting on particles, allowing coarser particles to slip through to the fine product. This raises the D-50 cut size, widens the particle size distribution, and lowers the Blaine value.
- Managing Circulating Load: While increasing rotor speed successfully elevates cement fineness, it also raises the circulating load because more material is rejected back to the grinding mill. Operators must carefully balance target Blaine requirements against mill throughput capacity, elevator limits, and specific energy consumption.
How to Interpret Tromp Curve Shape
The curve shape gives a fast indication of separator condition.
| Curve Feature | What It Indicates | Operational Meaning |
|---|---|---|
| Lower D50 | Finer cut size | Finer cement product is being targeted. |
| Higher D50 | Coarser cut size | More relatively large particles can enter the product. |
| Steep transition | Sharp separation | Better distinction between fine product and coarse reject. |
| Flat transition | Poor separation sharpness | More misplaced fine and coarse particles. |
| High lower-end intercept | High bypass | Feed is reaching product without effective classification. |
A fish hook effect may also be considered during curve review. It is an abnormal change in the fine-particle end of the Tromp curve and should be investigated as part of separator performance assessment.
Separator Efficiency and Circulating Load
Separator efficiency can also be estimated from circuit samples at selected sieve sizes. The assessment compares the size fractions in mill outlet or separator feed, separator fine product, and separator coarse reject. A common preliminary calculation is the circulating load, also called recirculation load. It represents the amount of coarse material returning to the mill relative to the fine product flow. For a selected size fraction, the calculation uses the measured values for:
- Separator coarse material
- Separator fine material
- Mill outlet or separator feed material
In practical cement mill evaluation, a circulating load below about 2 is generally associated with good separation performance, with a value around 1.8 often regarded as favourable. The actual result should always be interpreted alongside cement quality, mill output, separator settings, and the complete PSD data.
Why sieve-size efficiency values differ
Separator efficiency is not necessarily the same at every particle size. A calculation at 212 microns, 90 microns, and 45 microns can produce different values because the separator does not classify every size class with identical accuracy. For cement grinding, the 45-micron fraction is commonly a key focus because it is closely related to the control of coarse particles in the finished cement.
Separator Air Flow and Dust Load
Air flow is essential to dynamic separator performance. The circulating air flow can be determined from duct area and measured air velocity:
Air flow = duct cross-sectional area × air velocity
The relationship between separator feed and circulating air is used to assess separator loading. Separator feed load may be considered in kilograms of feed per cubic meter of circulating air, while dust load may be expressed as kilograms of fine product per cubic meter of air.
For cement separator operation, feed loading is commonly considered around 1.8 to 2.5 kg of feed per cubic meter of circulating air. Dust load is commonly assessed around 75 to 80 kg of fine product per cubic meter of air. These values should be used as operating references, not as a substitute for checking product quality and Tromp curve performance.
Practical Checklist for Improving Separator Performance
When the Tromp curve shows a high cut size, poor sharpness, excessive bypass, or inconsistent separation, use a structured review of the circuit.
- Verify sampling quality: Confirm that feed, reject, and product samples were taken from stable and representative streams.
- Check PSD data: Compare the complete particle size distributions, not only one residue value.
- Review D50: Confirm that the cut size matches the required cement fineness target.
- Review curve sharpness: A flatter curve can indicate poor classification between fine and coarse material.
- Check bypass: High bypass means a portion of feed is avoiding effective separation.
- Check circulating load: Excessive return material can increase mill workload and power demand.
- Review air flow: Verify circulating air flow using duct area and air velocity.
- Inspect guide vanes, baffles, and rotor components: Internal classification parts directly influence the material path.
- Compare performance with product quality: Evaluate residue, Blaine fineness, and production rate together.
Common Mistakes When Evaluating Cement Separators
Using Blaine fineness alone
Blaine fineness can be useful for product control, but it does not show how efficiently the separator classifies individual size fractions. Tromp analysis requires PSD information from feed, product, and reject streams.
Taking samples from the wrong locations
A separator study requires samples that correspond to the actual feed, reject, and fine product streams. Sampling a convenient point that does not represent one of these streams can distort the mass balance and the curve.
Ignoring bypass
A separator may appear to have a reasonable cut size while still allowing too much unclassified material into product. Bypass must be reviewed along with D50 and sharpness.
Judging performance from one value only
No single parameter fully describes separator performance. A low cut size is not enough if the curve is flat or bypass is high. Likewise, a sharp separation must still meet the required cement fineness and production target.
Key Takeaway
A Tromp curve turns separator performance into a practical, measurable picture. It shows where the separator cuts between fine and coarse particles, how precisely it makes that split, and how much material bypasses classification. For cement mill optimization, focus on the three core measures: D50 cut size, sharpness of separation, and bypass. Combine these results with circulating load, air flow, particle size distribution, residue, and product fineness to understand the complete grinding circuit.
Frequently Asked Questions About Tromp Curves and Cement Separators
What does D50 mean in a cement separator?
D50 is the cut size where particles have an equal probability of reporting to the fine product or coarse reject stream. A lower D50 generally means a finer cement product.
What are the three samples needed for a Tromp curve?
A Tromp curve requires representative samples of separator feed, separator reject, and separator fine product. Their particle size distributions are used to complete the size-by-size mass balance.
What is bypass in a separator Tromp curve?
Bypass is the portion of separator feed that reaches the product stream without effective classification. Higher bypass lowers separator efficiency.
Why is a sharp Tromp curve desirable?
A sharp curve indicates that the separator is making a clearer distinction between fine and coarse particles. A flat curve suggests more misplaced particles in both product and reject streams.
References
- Improvement of Productivity Using Tromp Curve Measurement for Cement Separator Processing Technology — T. K. Belhaj, M. G. Higazy, A. M. Gaafer, and B. A. K. ELMogy (Scientific Journal of October 6 University, 2017).